Tune in tomorrow morning at 7:30 AM to hear an announcement from Caltech, MIT and the Laser Interferometer Gravitational-wave Observatory (LIGO): www.caltech.edu.
Wednesday, February 10, 2016

Monday, February 8, 2016
Changing font in matplotlib
In order to change the font of text in a matplotlib figure, I needed a list of the available fonts. It took me a frustratingly long time to find this stack exchange answer, so I thought I would record the solution here.
import matplotlib.font_manager

{f.name for f in matplotlib.font_manager.fontManager.ttflist}
Then just choose a name from the set and insert it into a text command, e.g.
import matplotlib.pyplot as plt

plt.ion()

plt.title('title', fontname='FreeSans')
Wednesday, December 2, 2015
Programming new Reiser panels (G3)
I think I've mentioned the 'panels' that Michael Reiser developed while he was in Michael Dickinson's lab. These are widely used, but programming them can be a bit difficult and tedious. (By program, I mean upload the firmware to the panels themselves, not simply changing the address, which can be done easily over serial.) Will Dickson at iorodeo.com recently wrote a great little collection of shell scripts to make this process easier.
You will need a panel controller box, the panels you want to program, and an avrisp mkII.
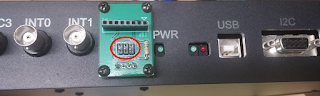
First, plug the mkII usb into your computer and the female header side into the six-pin header on the front of the controller box:
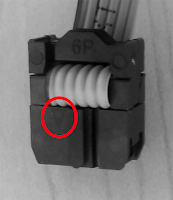
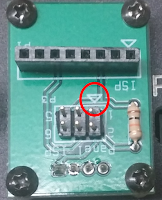
Make sure to align the small arrow on the avrisp mkII with the arrow on the header:
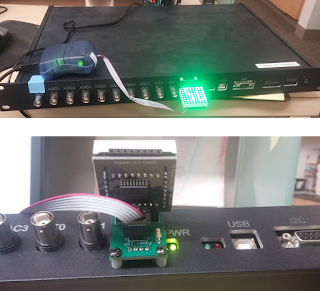
Next, plug a panel face-up into the female header:
Now, download and unzip the scripts from Will's bitbucket site. In a terminal, cd into the iorodeo-panels_prog_avrdude/program directory. Finally, run
(The first time, this might require your password.)
Note <address> is the panel address you want to assign to the panel in HEX. That's right, you need to convert to hex from decimal. To do this conversion, I use an interactive python prompt and the following:
You will need a panel controller box, the panels you want to program, and an avrisp mkII.
First, plug the mkII usb into your computer and the female header side into the six-pin header on the front of the controller box:

Make sure to align the small arrow on the avrisp mkII with the arrow on the header:


Next, plug a panel face-up into the female header:

Now, download and unzip the scripts from Will's bitbucket site. In a terminal, cd into the iorodeo-panels_prog_avrdude/program directory. Finally, run
./program_panel <address>
(The first time, this might require your password.)
Note <address> is the panel address you want to assign to the panel in HEX. That's right, you need to convert to hex from decimal. To do this conversion, I use an interactive python prompt and the following:
import numpy as np

np.set_printoptions(formatter={'int':lambda x:hex(int(x))})

print <address in decimal>
Friday, October 9, 2015
Fractal life
This week's special issue of Current Biology, especially Nicholas Butterfield's article on the Neoproterozoic, got me thinking about my favorite pre-Cambrian life form, Charnia. This organism is believed to have developed according to rigidly recursive rules, and I thought it would be fun to play with a terrific Python plotting library, pyqtgraph, in this context. I started with the discussion of recursion in this book. This animate gif is the result:

I think the result is kind of pretty. The (somewhat sloppy) code that produced the images is here:

I think the result is kind of pretty. The (somewhat sloppy) code that produced the images is here:
Friday, September 11, 2015
Using BrainAligner to warp z-stacks of Drosophila brains
In my recent paper on central complex processing during flight, I used BrainAligner to register z-stacks of Drosophila brains to one another. Getting it to work took a little fiddling, which I'll record below.
To install, follow directions here.
Next, right-click brainaligner_linux_redhat_fedora_64bit and choose properties. Under the Permissions tab, click the "Allow executing file as program" checkbox.
In terminal, type
and add
at the end of the file to add <rest of path to directory> to your path.
It gave me the following error
"error while loading shared libraries: libtiff.so.3: cannot open shared object file: No such file or directory"
Based on this stackoverflow answer, I ran
to get it to recognize libtiff.so.3
And it seems to work!
To work with multiple color channels, you have to go to image>type>RGB color to change a composite image to a 3 channel color image. BrainAligner will assume the first channel is the reference channel to use in the warping, unless you give it a different channel number as an argument.
After much testing, I found that the following command worked well:
./brainaligner_linux_redhat_fedora_64bit -t ./20150101/Z3_8b_c_b3.tif -s ./20150101/Z1_8b_c_b3.tif -o ./20150101/warpedZ1.tif -w 10 -B 341 -x 1 -z 1 -X 1 -Z 1
The file names of the image stacks remind me that after converting each z-stack to RGB color (image>type/RGB color in imageJ), I binned every three pixels. This resulted in stacks that were 341x341 pixels, and the x-y resolution was equal to the z resolution. BrainAligner worked in about 2 hours.
Definitely check the warped stack afterwards, because BrainAligner will fail if the initial two stacks are not very similar to begin with. (I was aligning two stack from the same animal before and after photoactivation, which was a relatively easy alignment problem.)
To install, follow directions here.
Next, right-click brainaligner_linux_redhat_fedora_64bit and choose properties. Under the Permissions tab, click the "Allow executing file as program" checkbox.
In terminal, type
gedit ~/.bashrc and add
export PATH="/home/$USER/<rest of path to directory>:$PATH"at the end of the file to add <rest of path to directory> to your path.
It gave me the following error
"error while loading shared libraries: libtiff.so.3: cannot open shared object file: No such file or directory"
Based on this stackoverflow answer, I ran
sudo ln -s /usr/lib/x86_64-linux-gnu/libtiff.so.4 /usr/lib/x86_64-linux-gnu/libtiff.so.3 to get it to recognize libtiff.so.3
And it seems to work!
To work with multiple color channels, you have to go to image>type>RGB color to change a composite image to a 3 channel color image. BrainAligner will assume the first channel is the reference channel to use in the warping, unless you give it a different channel number as an argument.
After much testing, I found that the following command worked well:
./brainaligner_linux_redhat_fedora_64bit -t ./20150101/Z3_8b_c_b3.tif -s ./20150101/Z1_8b_c_b3.tif -o ./20150101/warpedZ1.tif -w 10 -B 341 -x 1 -z 1 -X 1 -Z 1
The file names of the image stacks remind me that after converting each z-stack to RGB color (image>type/RGB color in imageJ), I binned every three pixels. This resulted in stacks that were 341x341 pixels, and the x-y resolution was equal to the z resolution. BrainAligner worked in about 2 hours.
Definitely check the warped stack afterwards, because BrainAligner will fail if the initial two stacks are not very similar to begin with. (I was aligning two stack from the same animal before and after photoactivation, which was a relatively easy alignment problem.)
Using ImageJ to count cell bodies in photoactivatable GFP experiment
In the PNAS paper, I counted cell bodies that contained photoactivated GFP after photoactivating the fan-shaped body. To do this, I followed this procedure: Acquire z-stacks before and after photoactivation, then align the first stack to the second stack using brainAligner (instructions here).
Next, download and install the Cell Counter plugin for imageJ.
Open both z-stacks. Make sure they have the same dimensions. (If not, scale them.)
Go to Plugins>Cell Counter
initialize Cell Counter on the after-activation stack.
Make sure the Counter Window (after activation z-stack) has focus, then click Analyze>Tools>Sync Windows
Now you can go through and click cell bodies that are greener in the after-activation stack than the before-activation stack.

Next, download and install the Cell Counter plugin for imageJ.
Open both z-stacks. Make sure they have the same dimensions. (If not, scale them.)
Go to Plugins>Cell Counter
initialize Cell Counter on the after-activation stack.
Make sure the Counter Window (after activation z-stack) has focus, then click Analyze>Tools>Sync Windows
Now you can go through and click cell bodies that are greener in the after-activation stack than the before-activation stack.

Tuesday, September 8, 2015
Functional divisions for visual processing in the central brain of flying Drosophila
Subscribe to:
Posts (Atom)